<=Back
<=KNEC Craft Certificate in ICT module 1 Mathematics past paper: November 2021 with video(s)
Table 2 shows lunch preferences for 195 students when taken out for three different trips. Use it to answer the question that follows.
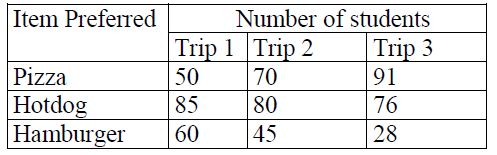
Represent this information in a clustered column chart.
Represent this information in a clustered column chart.
Viewed: 916 times
For Better experience and learning,for video answers, after video ends playing, click next question in the questions list!!!
Share in:


Questions List:
1. Convert the decimal number #7423_10# to its equivalent for each of the following number systems: a)Octal b)BCD
2. Convert the octal number #325_8# to its equivalent for each of the following number systems: a)Excess-3 b)Hexadecimal.
3. Use graphical method to solve the following set of equations: 4y + 3x = 100 4y − 193 = 12
4. Given that set U={a, b, c, d, b, e, f, g, h}, B={a, c, d, e} and A={a, b, c}; Determine each of the following operations: a)AnB; b)#A^c#nB
5. Use the binomial theorem to expand the following expression #(4x + 3)^4#
6. Describe each of the following matrices: a)Diagonal matrix: b)Triangular matrix.
7. Given the matrices #x=[[1,5,-1],[-1,2,2],[0,-3,3]]# and #Y=[[-1,-4,3],[1,-2,-2],[-3,3,-5]]# determine X+3Y
8. Solve 5x ≤ −4y − 12 and represent the solution on a graph.
9. Determine the fourth term of the expression #(3x + y)^7#
10. Explain each of the following terms as used in statistics. a)discrete variable; b)continuous variable.
11. Given Matrix S=#[[1,7],[9,2]]# and R=#[[2,4],[4,3]]# show that i)SR #!=# RS ii)#(SR)^T=S^TR^T#
12. A quadratic equation has Z and -3 as its roots. Determine its equation.
13. Differentiate between floating point and fixed point methods of data representation.
14. Outline five advantages of arithmetic mean as a measure of central tendency in statistics.
15. Use the binomial theorem to expand the binomial expression #(x − 2y)^5# .
16. Given three sets A, B and C, draw a Venn diagram and shade the area representing each of the following: i)AUBUC; ii)AU(BnC)
17. Outline two types of skewness in statistics.
18. Table 1 shows the frequency distribution of weight of patients who attended a hospital. Use it to answer the questions that follow. Determine each of the following measures about patient’s weight: I. Mean II. Standard deviation
19. Use the substitution method to solve the following set of equations: y − 4x = 3 y + 3x = 17
20. Table 2 shows lunch preferences for 195 students when taken out for three different trips. Use it to answer the question that follows. Represent this information in a clustered column chart.
21. With the aid of a sketch, describe the three types of Kurtosis in statistics.
22. Use the Pascal’s triangle to expand the binomial expression #(2x − 5)^4#.
23. Use the inverse matrix method to solve the following systems of equation: 3x + 2y = 33 5x − 7y = −7
24. Define each of the following terms as used in probability: i)Event; ii)Outcome: iii)Sample space.
25. Given that the universal set is the set of all even numbers less than 30 and sets A= {4, 8, 12, 16, 20, 24, 28} B= {6, 12, 18, 24, 28}. i)Use a Venn diagram to represent this information. ii)Determine AᴒBc.
26. A swimming coach intends to choose 3 swimmers from group of 5. Determine the number of ways the coach can use to choose the swimmers.